1. Introduction
Hello! We are a writer team from Definer Inc.
In this issue, you are wondering about the use of the overall picture of GCP data monitoring service.
Let's take a look at the actual screens and resources to explain in detail.
2. Purpose/Use Cases
This article summarizes helpful information and practices with the goal of providing a complete picture of GCP's resource monitoring services.
3. Why do we should monitoring cloud resources?
Monitoring is vital for maintaining the health, performance, and reliability of your applications and infrastructure. By continuously tracking and analyzing metrics, logs, and traces, you can gain valuable insights and ensure optimal system operation.
Monitoring allows you to detect and troubleshoot issues promptly. By monitoring metrics such as CPU usage, memory utilization, and network traffic, you can identify performance bottlenecks, anomalies, and error patterns. This helps you pinpoint the root causes of problems and take immediate remedial actions, minimizing the impact on your users.
Furthermore, monitoring helps optimize resource utilization and cost efficiency. By analyzing resource metrics, you can identify underutilized or overutilized resources and make informed decisions on scaling and resource allocation. This ensures that you are utilizing your resources effectively and minimizing unnecessary expenses.
Monitoring also plays a crucial role in meeting compliance requirements and conducting audits. By collecting and retaining logs, you can track user activities, system events, and security incidents. This aids in compliance regulations, incident response, and forensic analysis.
Proactive incident management is facilitated through monitoring. By setting up alerting policies based on predefined thresholds or custom conditions, you can receive timely notifications when issues occur. This allows you to take immediate action and mitigate the impact of incidents.
Capacity planning is another key benefit of monitoring. By analyzing historical data and forecasting resource demands, you can scale your infrastructure proactively. This ensures that you have sufficient resources to handle workload growth and maintain optimal system performance.
4. Summary of GCP monitoring services (1) Cloud Monitoring
Let us introduce you to GCP's monitoring services.
The first one is Cloud Monitoring.
Cloud Monitoring
・Google Cloud Monitoring is a comprehensive monitoring service that allows you to collect, view, and analyze metrics from various Google Cloud services and custom applications. It provides you with real-time visibility into the health, performance, and behavior of your resources. With features like Metrics Explorer, Dashboards, and Alerting, you can gain insights, track KPIs, and receive notifications when conditions are met.
・Cloud Monitoring monitors latency, traffic (request volume), error rates, CPU and other resource usage for each cloud resource.
・In addition to GCP, you can also monitor AWS resources.
・Dashboard visualization and alert notifications are also available.
・The fee is free for the metrics that GCP collects by default, while custom metrics are charged based on the amount of data and other factors.
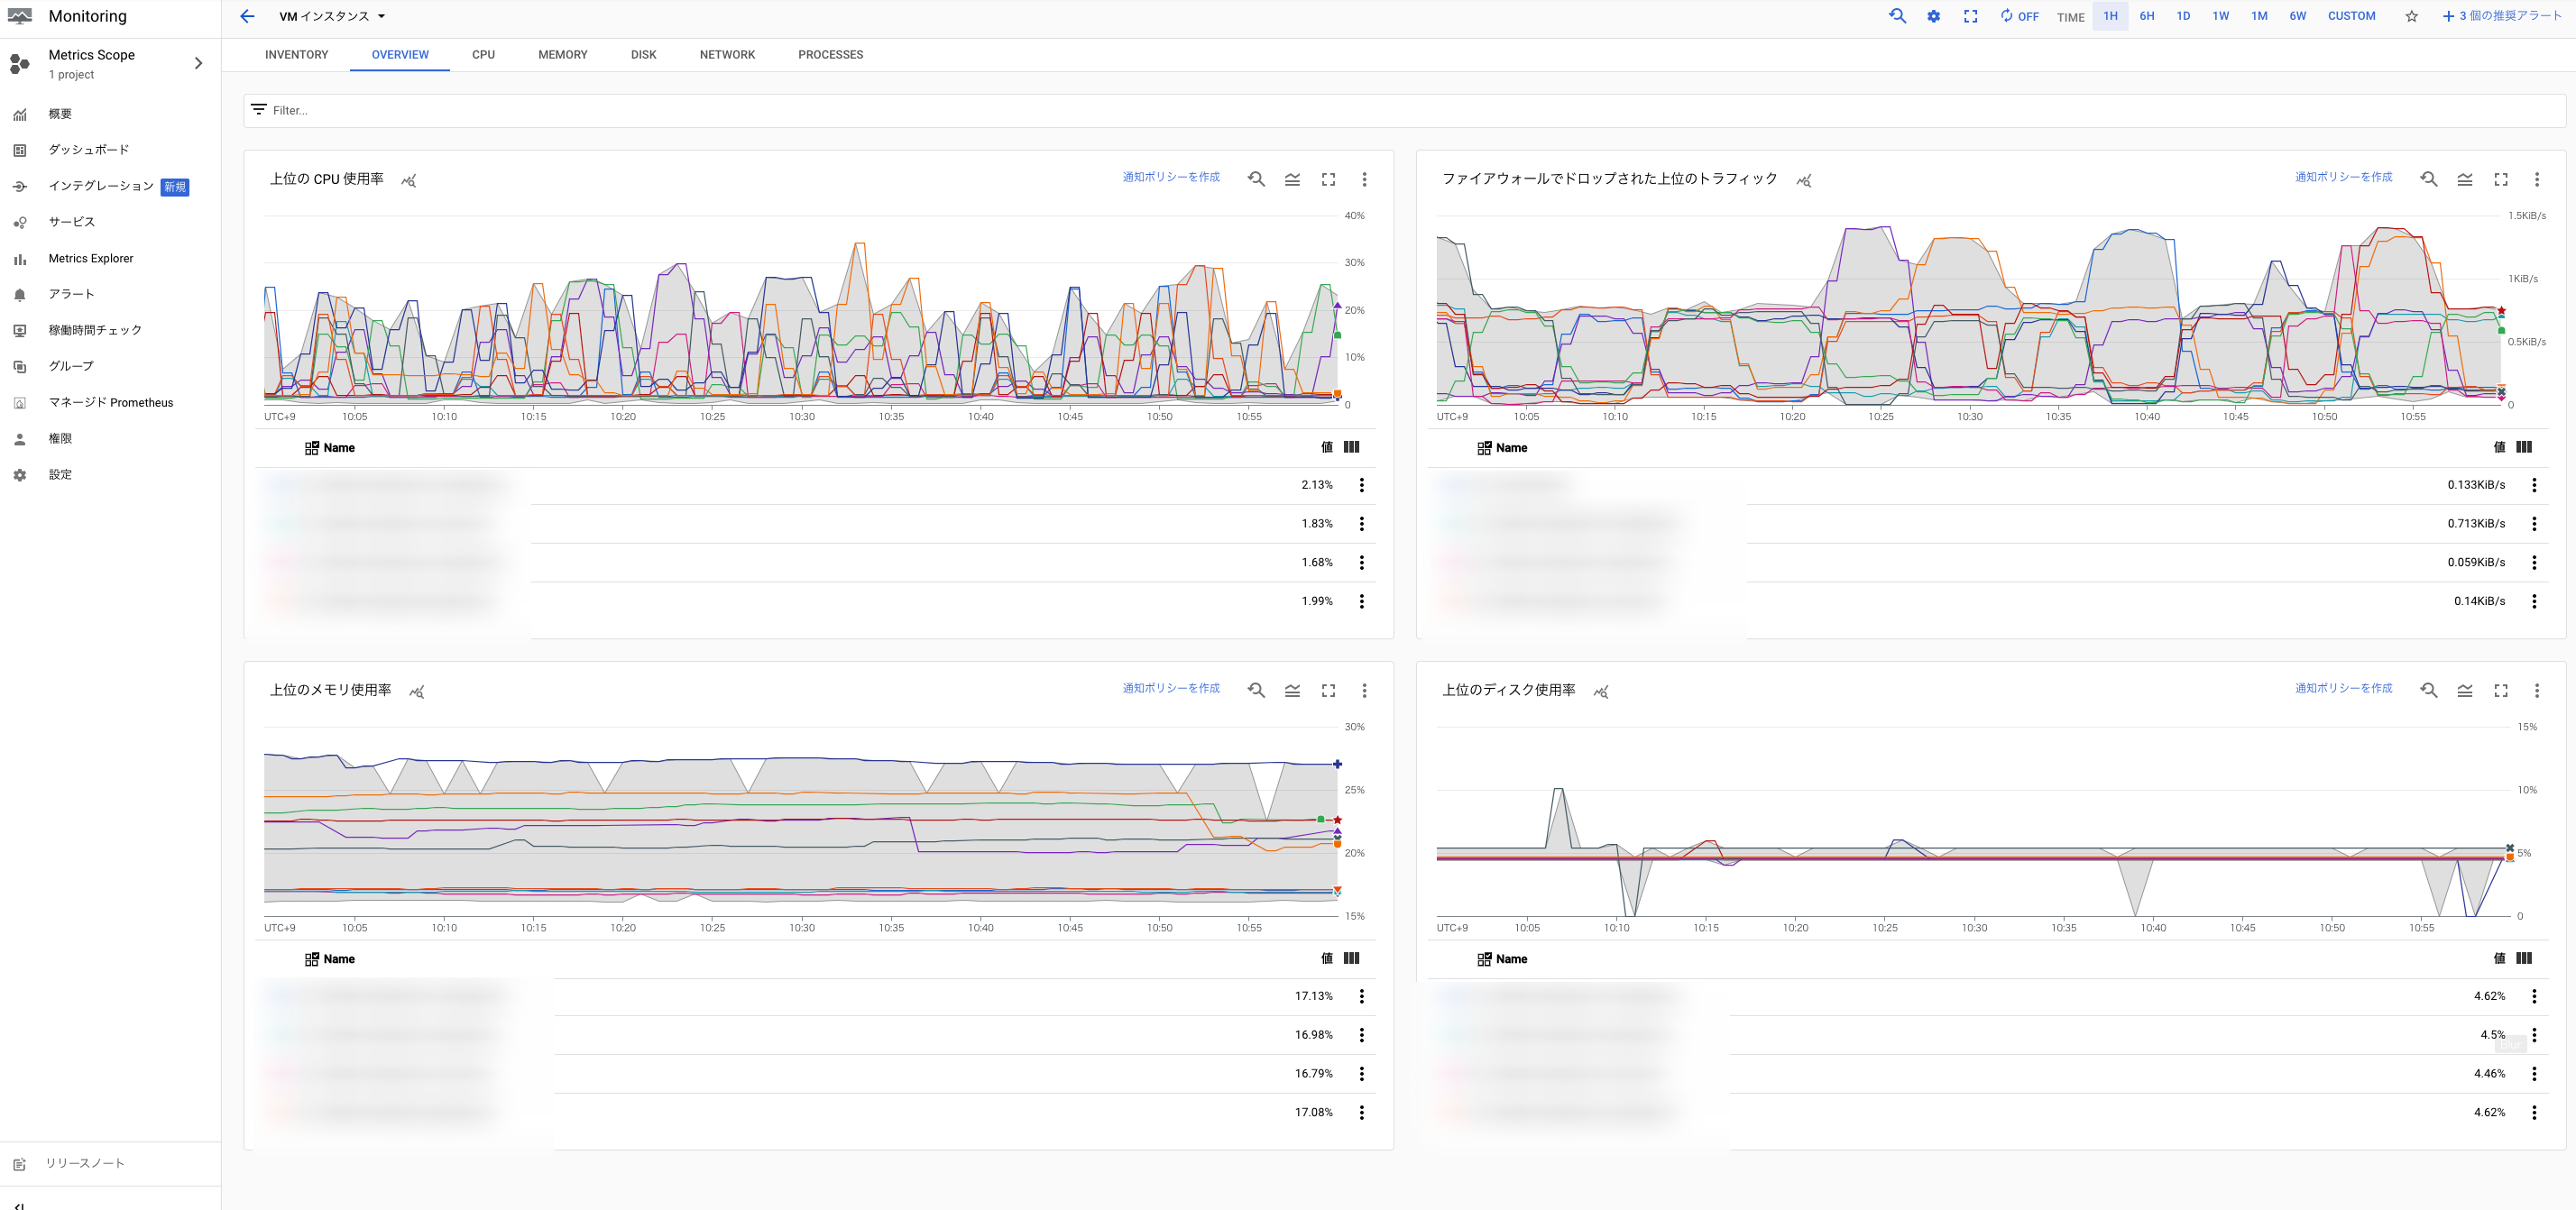
Go to "Monitoring" service, in there we can see the overview of CPU/Memory/Disk usage, etc.
 Upper-level process using the resource
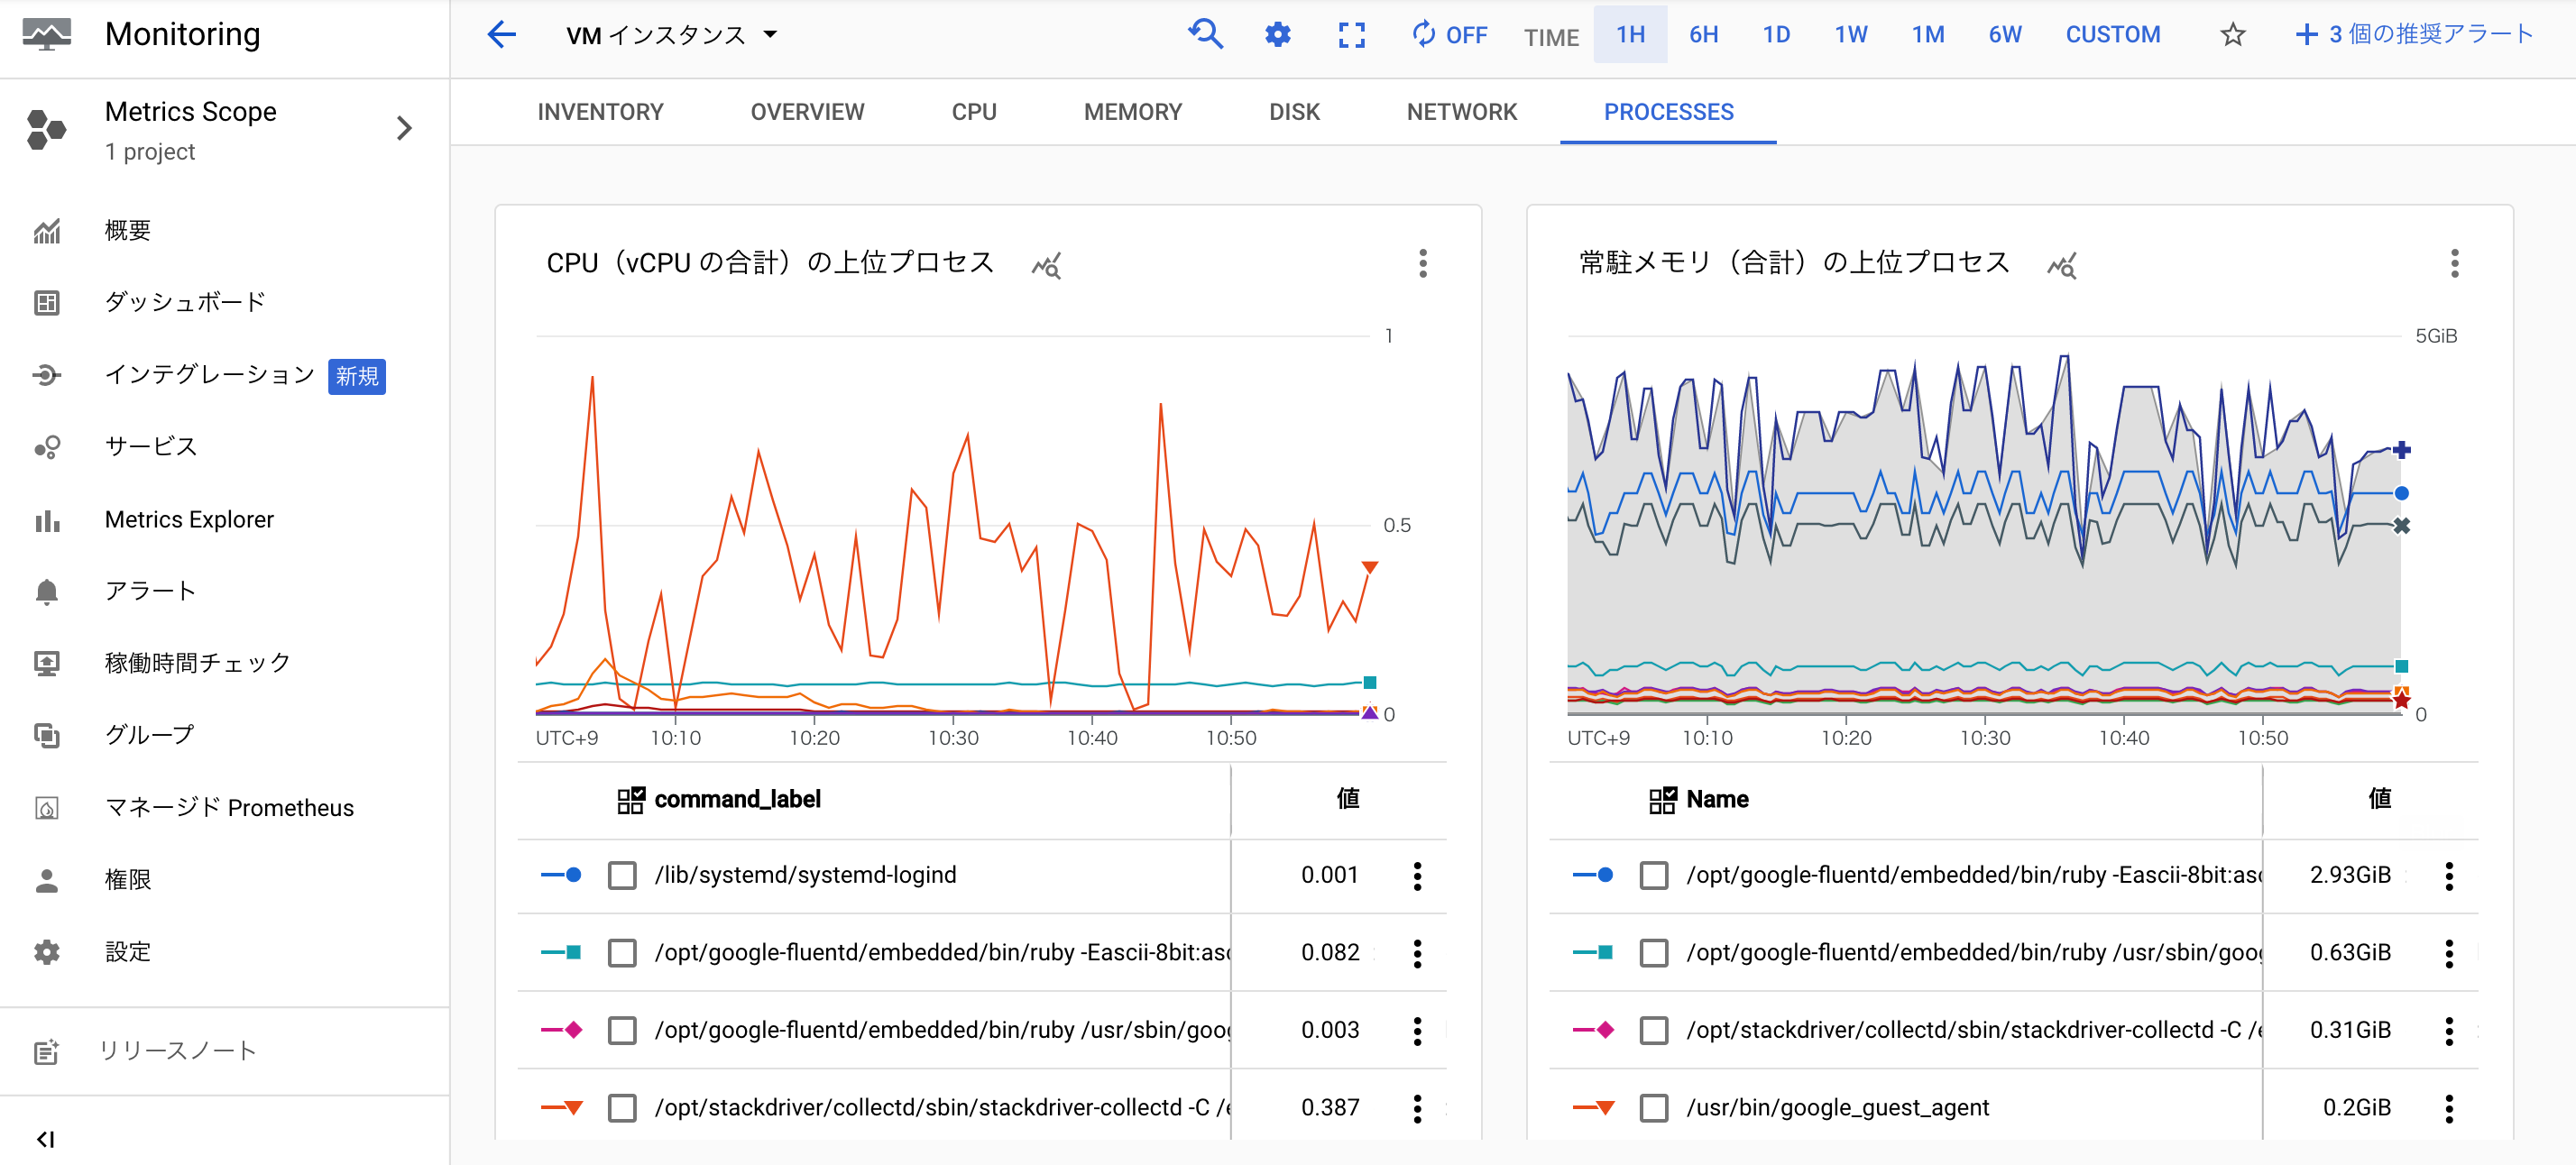
Upper-level process using the resource
5. Summary of GCP's monitoring services (2) Cloud Logging
Next, we introduce Cloud Logging.
Cloud Logging
・Cloud Logging is a log monitoring service that can monitor logs from GCP, AWS, and on-premises.
・You can execute queries from the Log Explorer console.
・Alerts can be created based on queries.
・By combining with Cloud Pub/Sub and Cloud Functions, you can build a more flexible and unique notification system.
・The logs are stored for 30 days by default, so please export them to GCS and save them.
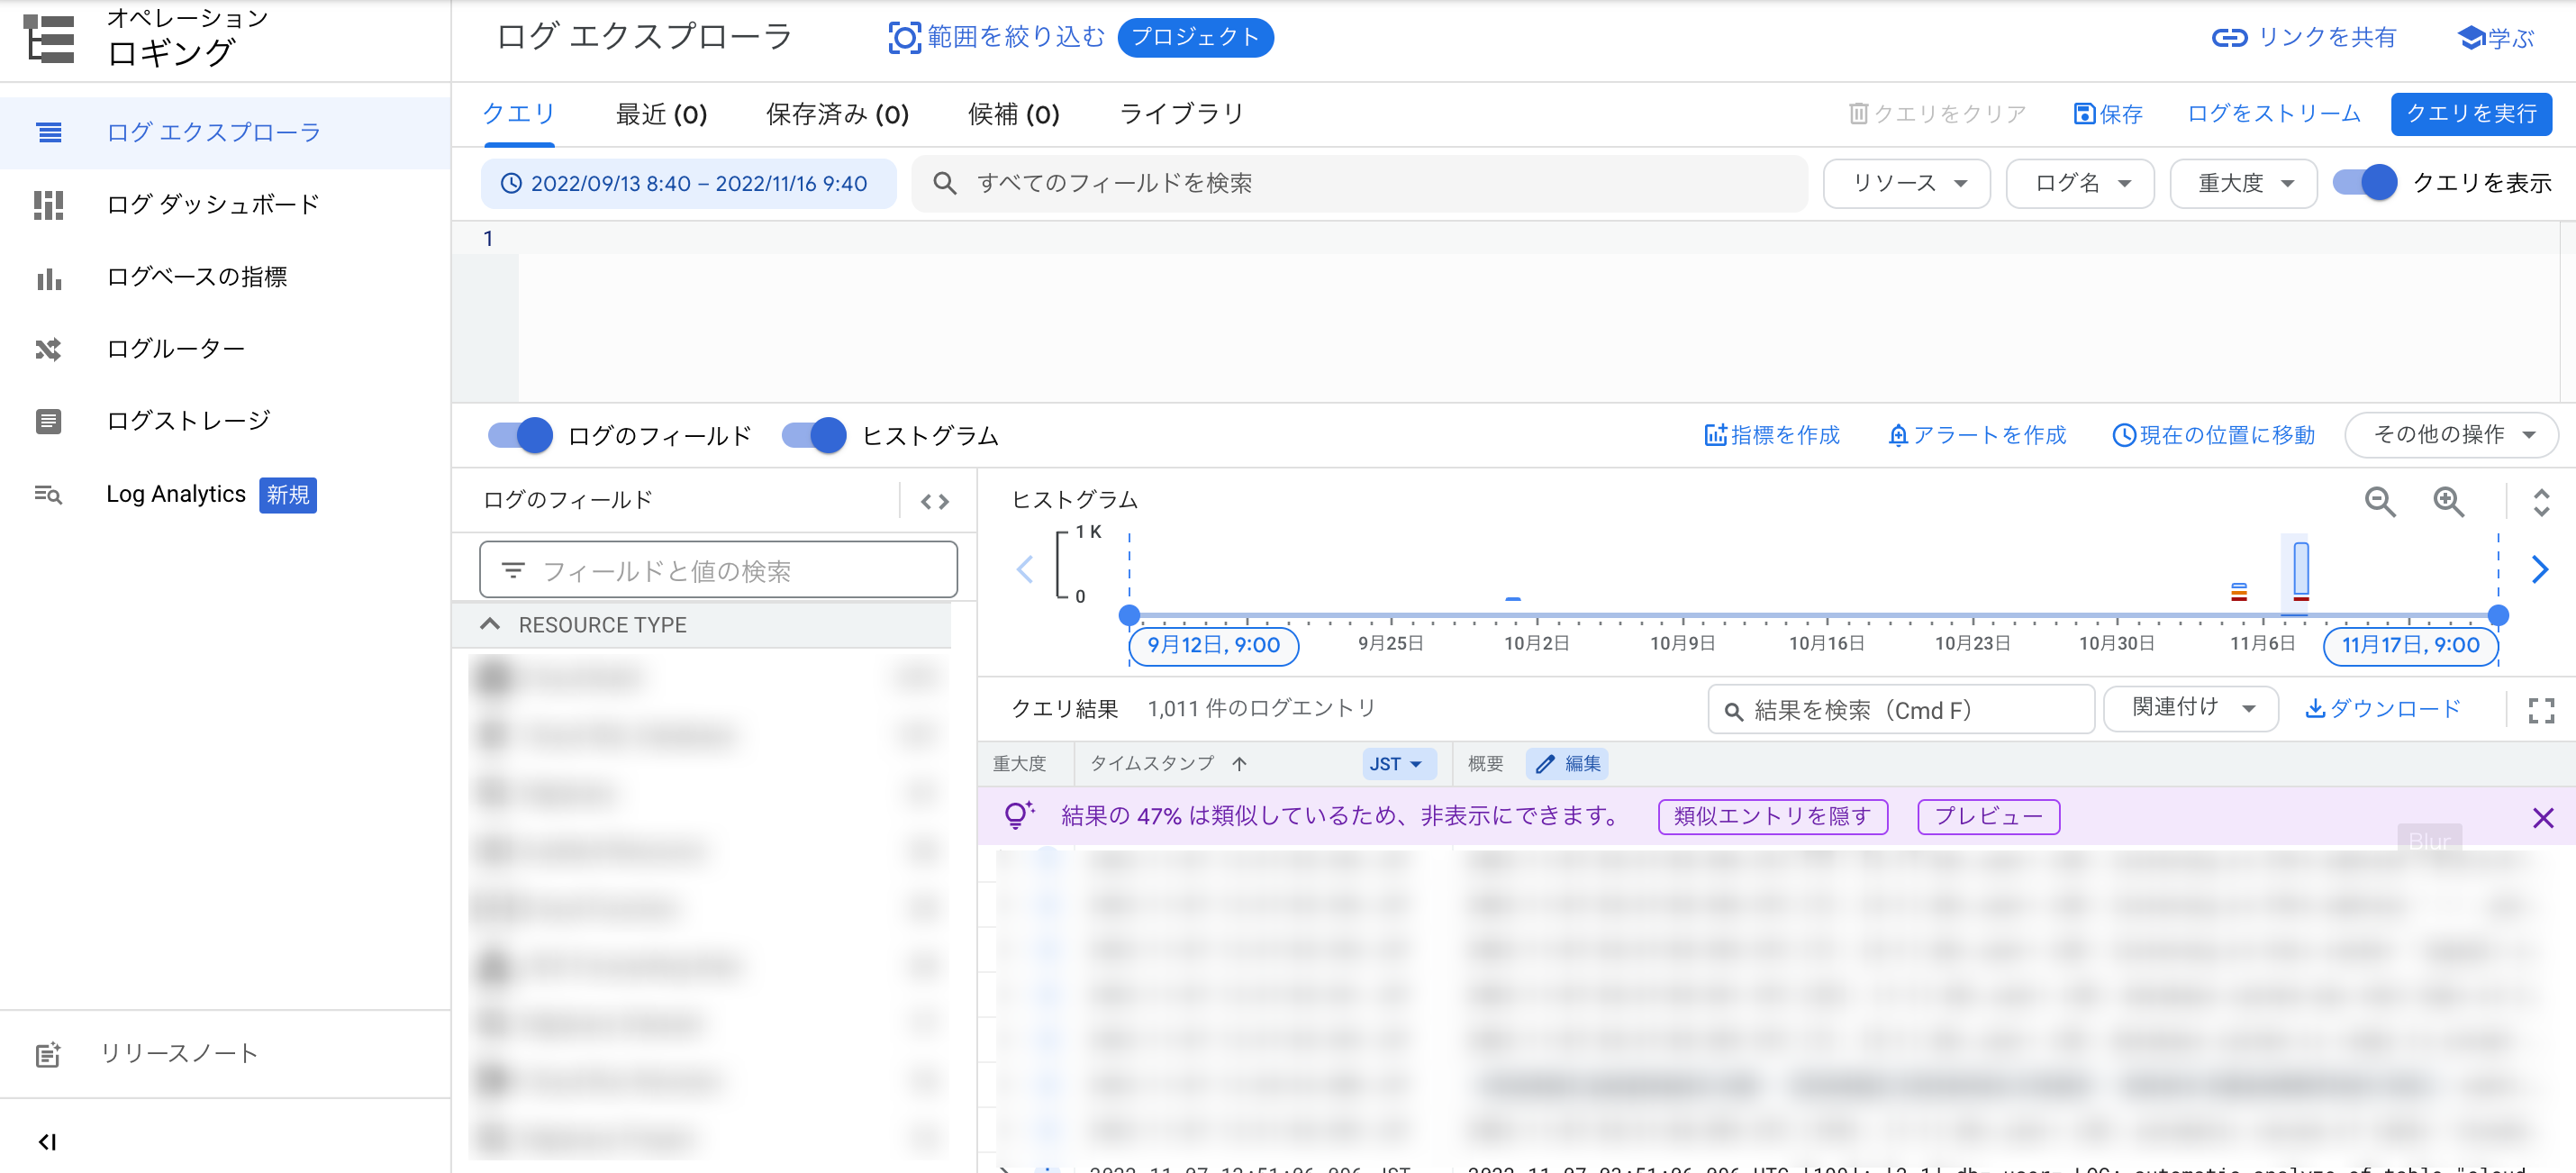
Go to "Logging" service and here is Log Explorer screen:
6. Comparison
Google Cloud Platform (GCP) Monitoring and GCP Logging are two distinct services provided by Google Cloud, each serving a different purpose in the monitoring and observability ecosystem. Here are the key differences between GCP Monitoring and GCP Logging:
Purpose:
- GCP Monitoring: GCP Monitoring focuses on collecting, visualizing, and alerting on various metrics related to the health, performance, and behavior of your applications and infrastructure. It provides real-time visibility into the operational aspects of your system.
- GCP Logging: GCP Logging is designed for centralizing, searching, analyzing, and storing log data generated by your applications and infrastructure. It helps you troubleshoot issues, gain insights, and meet compliance requirements.
- GCP Monitoring: GCP Monitoring primarily deals with metric data. It collects and visualizes metrics related to CPU usage, memory utilization, request latency, network traffic, and other performance indicators. These metrics provide a quantitative view of your system's behavior.
- GCP Logging: GCP Logging focuses on log data, which represents textual records of events, activities, or messages generated by your applications and services. Log data provides a qualitative view of your system's behavior and can include information like application logs, system logs, audit logs, and more.
- GCP Monitoring: GCP Monitoring collects metrics from various sources, including Google Cloud services and custom applications running on GCP. It automatically gathers and aggregates metric data, allowing you to monitor and analyze system-level and application-level performance.
- GCP Logging: GCP Logging collects logs from multiple sources, such as applications, services, and infrastructure. It provides flexibility in log collection, allowing you to send logs directly via API calls, use logging agents, or integrate with various Google Cloud services that generate logs.
- GCP Monitoring: GCP Monitoring offers features like Metrics Explorer and Dashboards to visualize and analyze metric data. It provides predefined and customizable charts, graphs, and visualizations to track performance indicators, set up thresholds, and detect anomalies.
- GCP Logging: GCP Logging provides robust search and filtering capabilities for log data. You can search for specific log entries, filter logs based on criteria, and perform advanced queries. Additionally, you can analyze log data, create metrics based on log entries, and generate insights from log patterns.
- GCP Monitoring: GCP Monitoring includes alerting capabilities, allowing you to set up alerting policies based on predefined or custom conditions. When a threshold or condition is met, it sends notifications via email, SMS, or third-party integrations.
- GCP Logging: GCP Logging supports log-based metrics and the creation of log-based alerts. You can define conditions based on specific log entries or patterns and receive alerts when those conditions are met.
- GCP Monitoring: GCP Monitoring integrates with various Google Cloud services, enabling you to monitor the health and performance of those services and gain insights into their behavior. It seamlessly integrates with services like Compute Engine, App Engine, Kubernetes Engine, Cloud Functions, and more.
- GCP Logging: GCP Logging integrates with other Google Cloud services as well, allowing you to collect logs generated by those services. It also integrates with GCP Monitoring, enabling correlation of log data with metrics and traces for a comprehensive view of your system's behavior.
7. Cited/Referenced Articles
8. About the proprietary solution "PrismScaler"
・PrismScaler is a web service that enables the construction of multi-cloud infrastructures such as AWS, Azure, and GCP in just three steps, without requiring development and operation.
・PrismScaler is a web service that enables multi-cloud infrastructure construction such as AWS, Azure, GCP, etc. in just 3 steps without development and operation.
・The solution is designed for a wide range of usage scenarios such as cloud infrastructure construction/cloud migration, cloud maintenance and operation, and cost optimization, and can easily realize more than several hundred high-quality general-purpose cloud infrastructures by appropriately combining IaaS and PaaS.

9. Contact us
This article provides useful introductory information free of charge. For consultation and inquiries, please contact "Definer Inc".
10. Regarding Definer
・Definer Inc. provides one-stop solutions from upstream to downstream of IT.
・We are committed to providing integrated support for advanced IT technologies such as AI and cloud IT infrastructure, from consulting to requirement definition/design development/implementation, and maintenance and operation.
・We are committed to providing integrated support for advanced IT technologies such as AI and cloud IT infrastructure, from consulting to requirement definition, design development, implementation, maintenance, and operation.
・PrismScaler is a high-quality, rapid, "auto-configuration," "auto-monitoring," "problem detection," and "configuration visualization" for multi-cloud/IT infrastructure such as AWS, Azure, and GCP.