DEVELOPER BLOG

HOME > DEVELOPER BLOG > 【Introduction to Azure】A summary of what you can do with Azure Monitor - PrismScaler

【Introduction to Azure】A summary of what you can do with Azure Monitor - PrismScaler

1. Introduction

Hello! We are a writer team from Definer Inc. Azure Monitor is a comprehensive monitoring and diagnostics service provided by Microsoft Azure. It enables you to gain insights into the performance, health, and availability of your Azure resources and applications. Azure Monitor collects and analyzes telemetry data from various sources, allowing you to monitor, detect, diagnose, and respond to issues in your Azure environment. It provides a centralized platform for monitoring and managing your Azure resources effectively. In this issue, you are wondering what you can do with Azure Monitor. Let's take a look at the actual screens and resources to explain in detail.

2. Purpose/Use Cases

This article will utilize the Azure Monitor technology for the purpose of understanding Azure's monitoring services. It summarizes information and practices that can be helpful when you want to use Azure Monitor to monitor resources in an IT setting.

Monitoring Azure Resources

Application Performance Monitoring (APM)

Log Analytics

Alerting and Notifications

Autoscaling and Capacity Planning

Security Monitoring

Insights and Analytics

3. What you can do with Azure Monitor

Azure Monitor is a managed service for system monitoring. It provides integrated collection, visualization, and analysis of logs, CPU, memory, and other resource information for virtual machines and other devices. Individual monitoring and analysis services such as Azure Application Insights and Azure Log Analytics have been integrated into a single monitoring solution, Azure Monitor.   As a functionality, the following can be achieved   Monitoring of Azure Cloud   ・Checking activity logs Check user API operations and accesses between Azure services.   ・Service normality management Check Azure failures, etc.   IaaS Monitoring   ・Check resource metrics Check CPU, memory, etc. for each resource. You can also create a dashboard by picking up necessary metrics.   ・Check logs Check application logs, OS logs, and other acquired logs.   Alerts   ・Alert management Alarms can be set for metrics, log search queries, activity log events, etc. Alarms can be set to severity levels such as error/warning/info. Alarms can also be assigned severity levels such as error/warning/info.

4. Try Azure Monitor

Now let's actually try the Azure Monitor.   (1) Checking Azure Service Health: To check the normality of Azure and verify if any failures have occurred, follow these steps:

Navigate to the Azure portal and go to the "Monitor" section.

Click on "Service Health" or a similar option available.

In the Service Health dashboard, you can view the overall health status of Azure services, regions, and resource providers.

Check the service health advisories, incidents, and planned maintenance notifications to identify any ongoing or recent issues affecting Azure services.

Azure Service Health provides real-time updates, historical information, and recommended actions in case of service disruptions or outages.

By regularly monitoring the Azure Service Health dashboard, you can stay informed about the status of Azure services and quickly respond to any issues that may impact your applications or resources.     
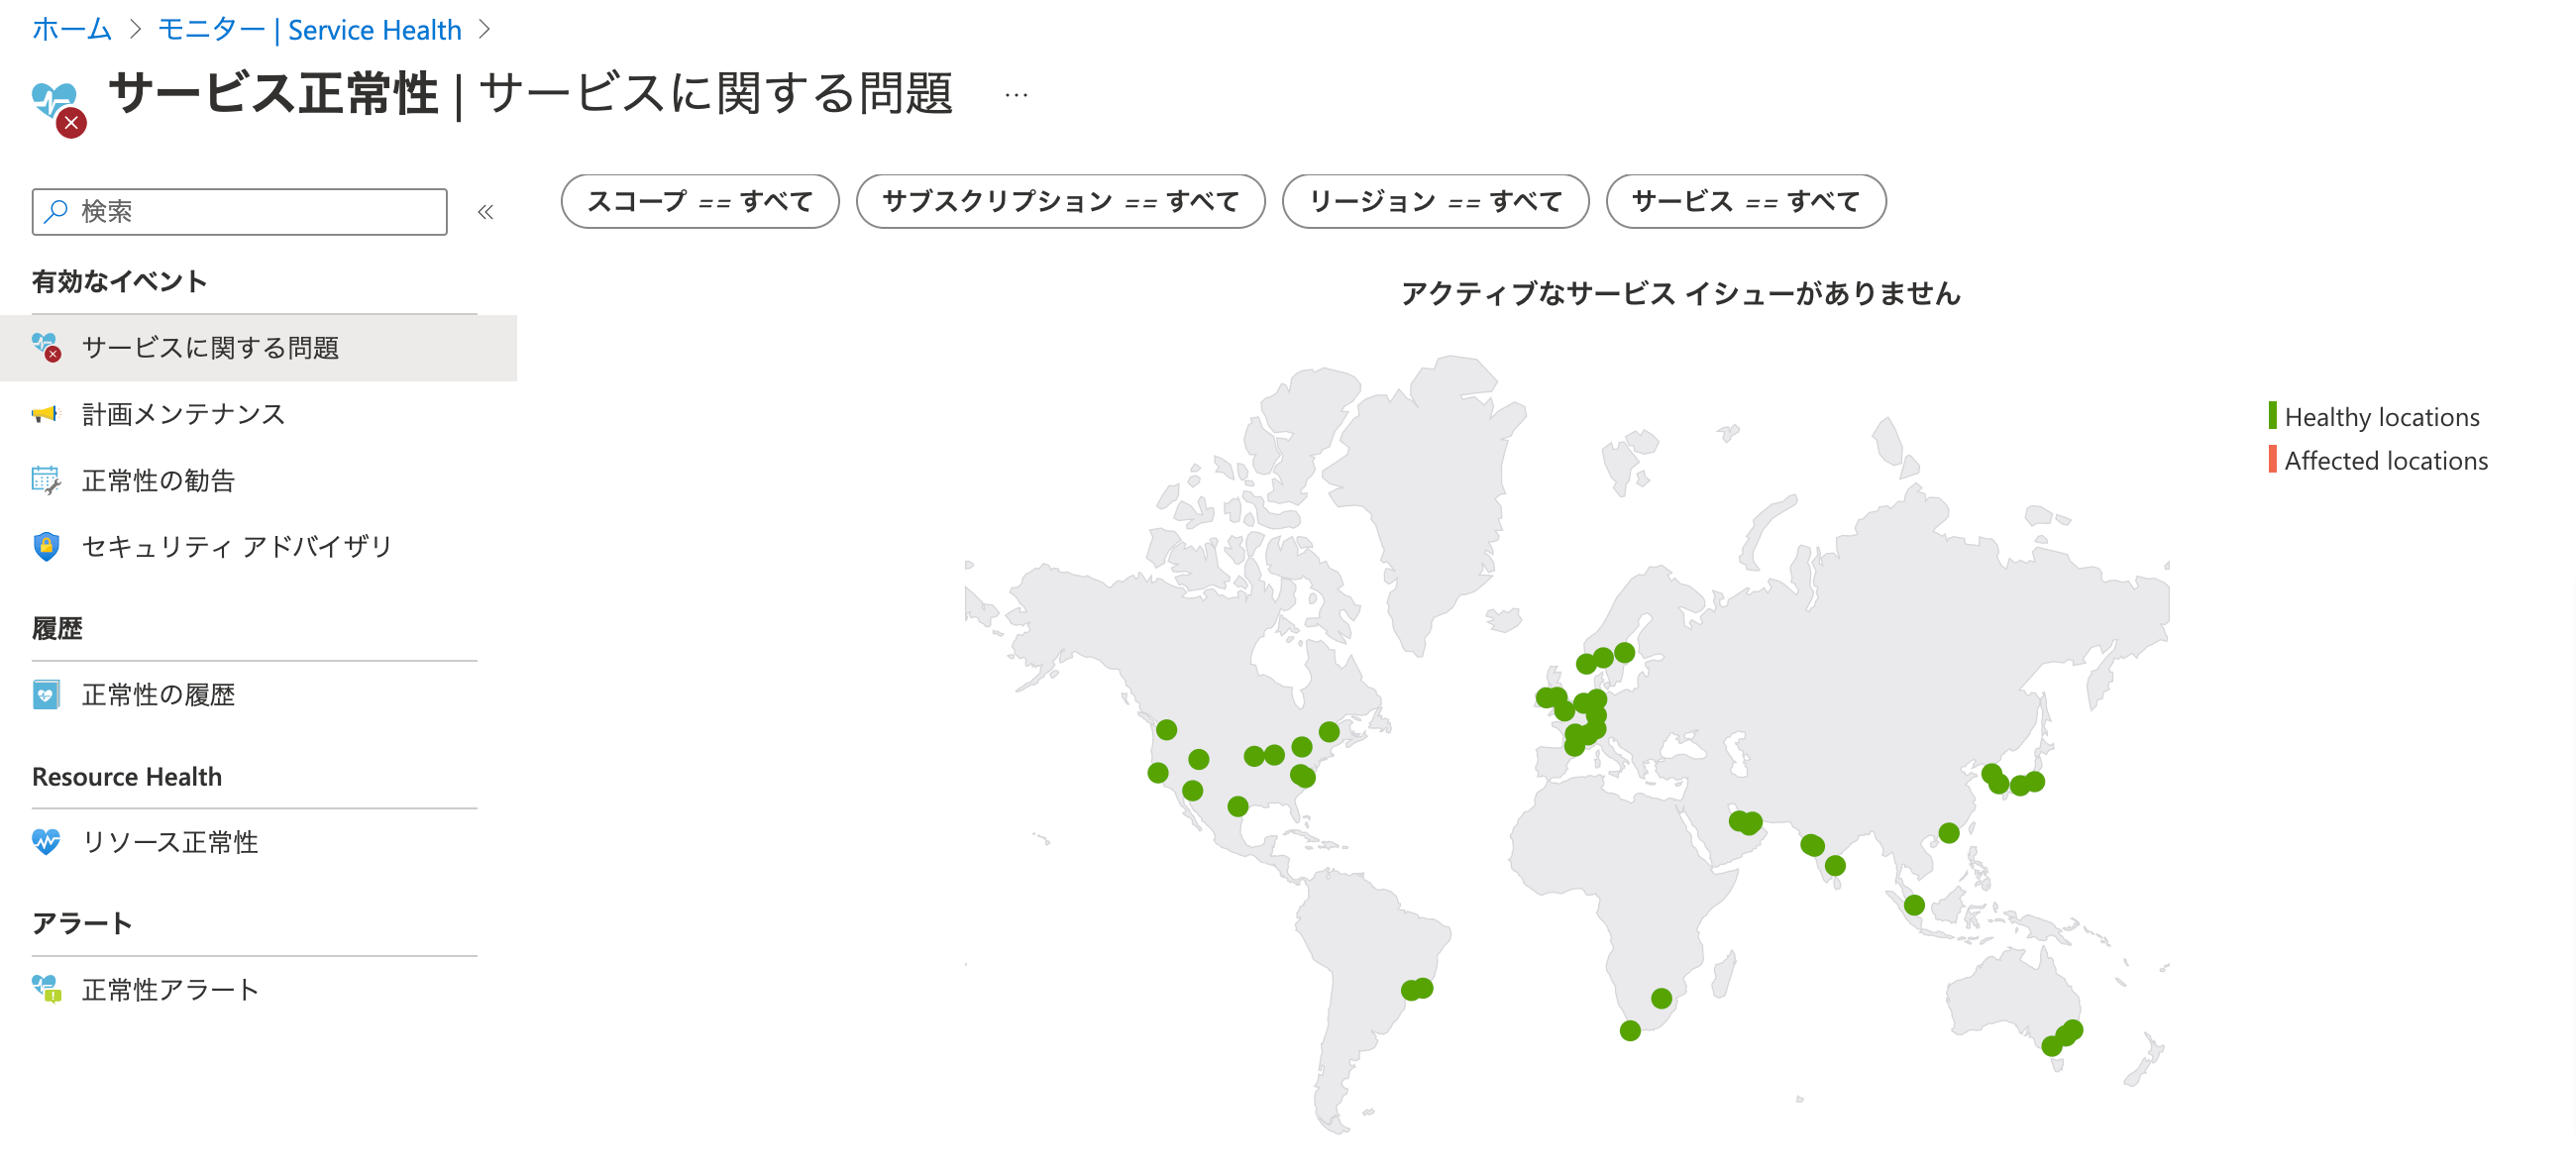
(2) Accessing the Activity Log: To access the Activity Log and review the history of API calls in Azure, follow these steps:

Go to the Azure portal and navigate to the "Monitor" section.

Click on "Activity Log" or a similar option available.

The Activity Log provides a comprehensive view of the operations performed within your Azure subscription.

You can filter and search for specific events based on the subscription, resource group, resource type, or time range.

Each event in the Activity Log includes information such as the operation type, resource, timestamp, and the identity responsible for the action.

Use the Activity Log to track changes, investigate issues, and audit activity within your Azure environment.

By reviewing the Activity Log, you can gain visibility into the activities performed on your Azure resources, track changes made by users or automation processes, and troubleshoot any unexpected behavior or errors.  

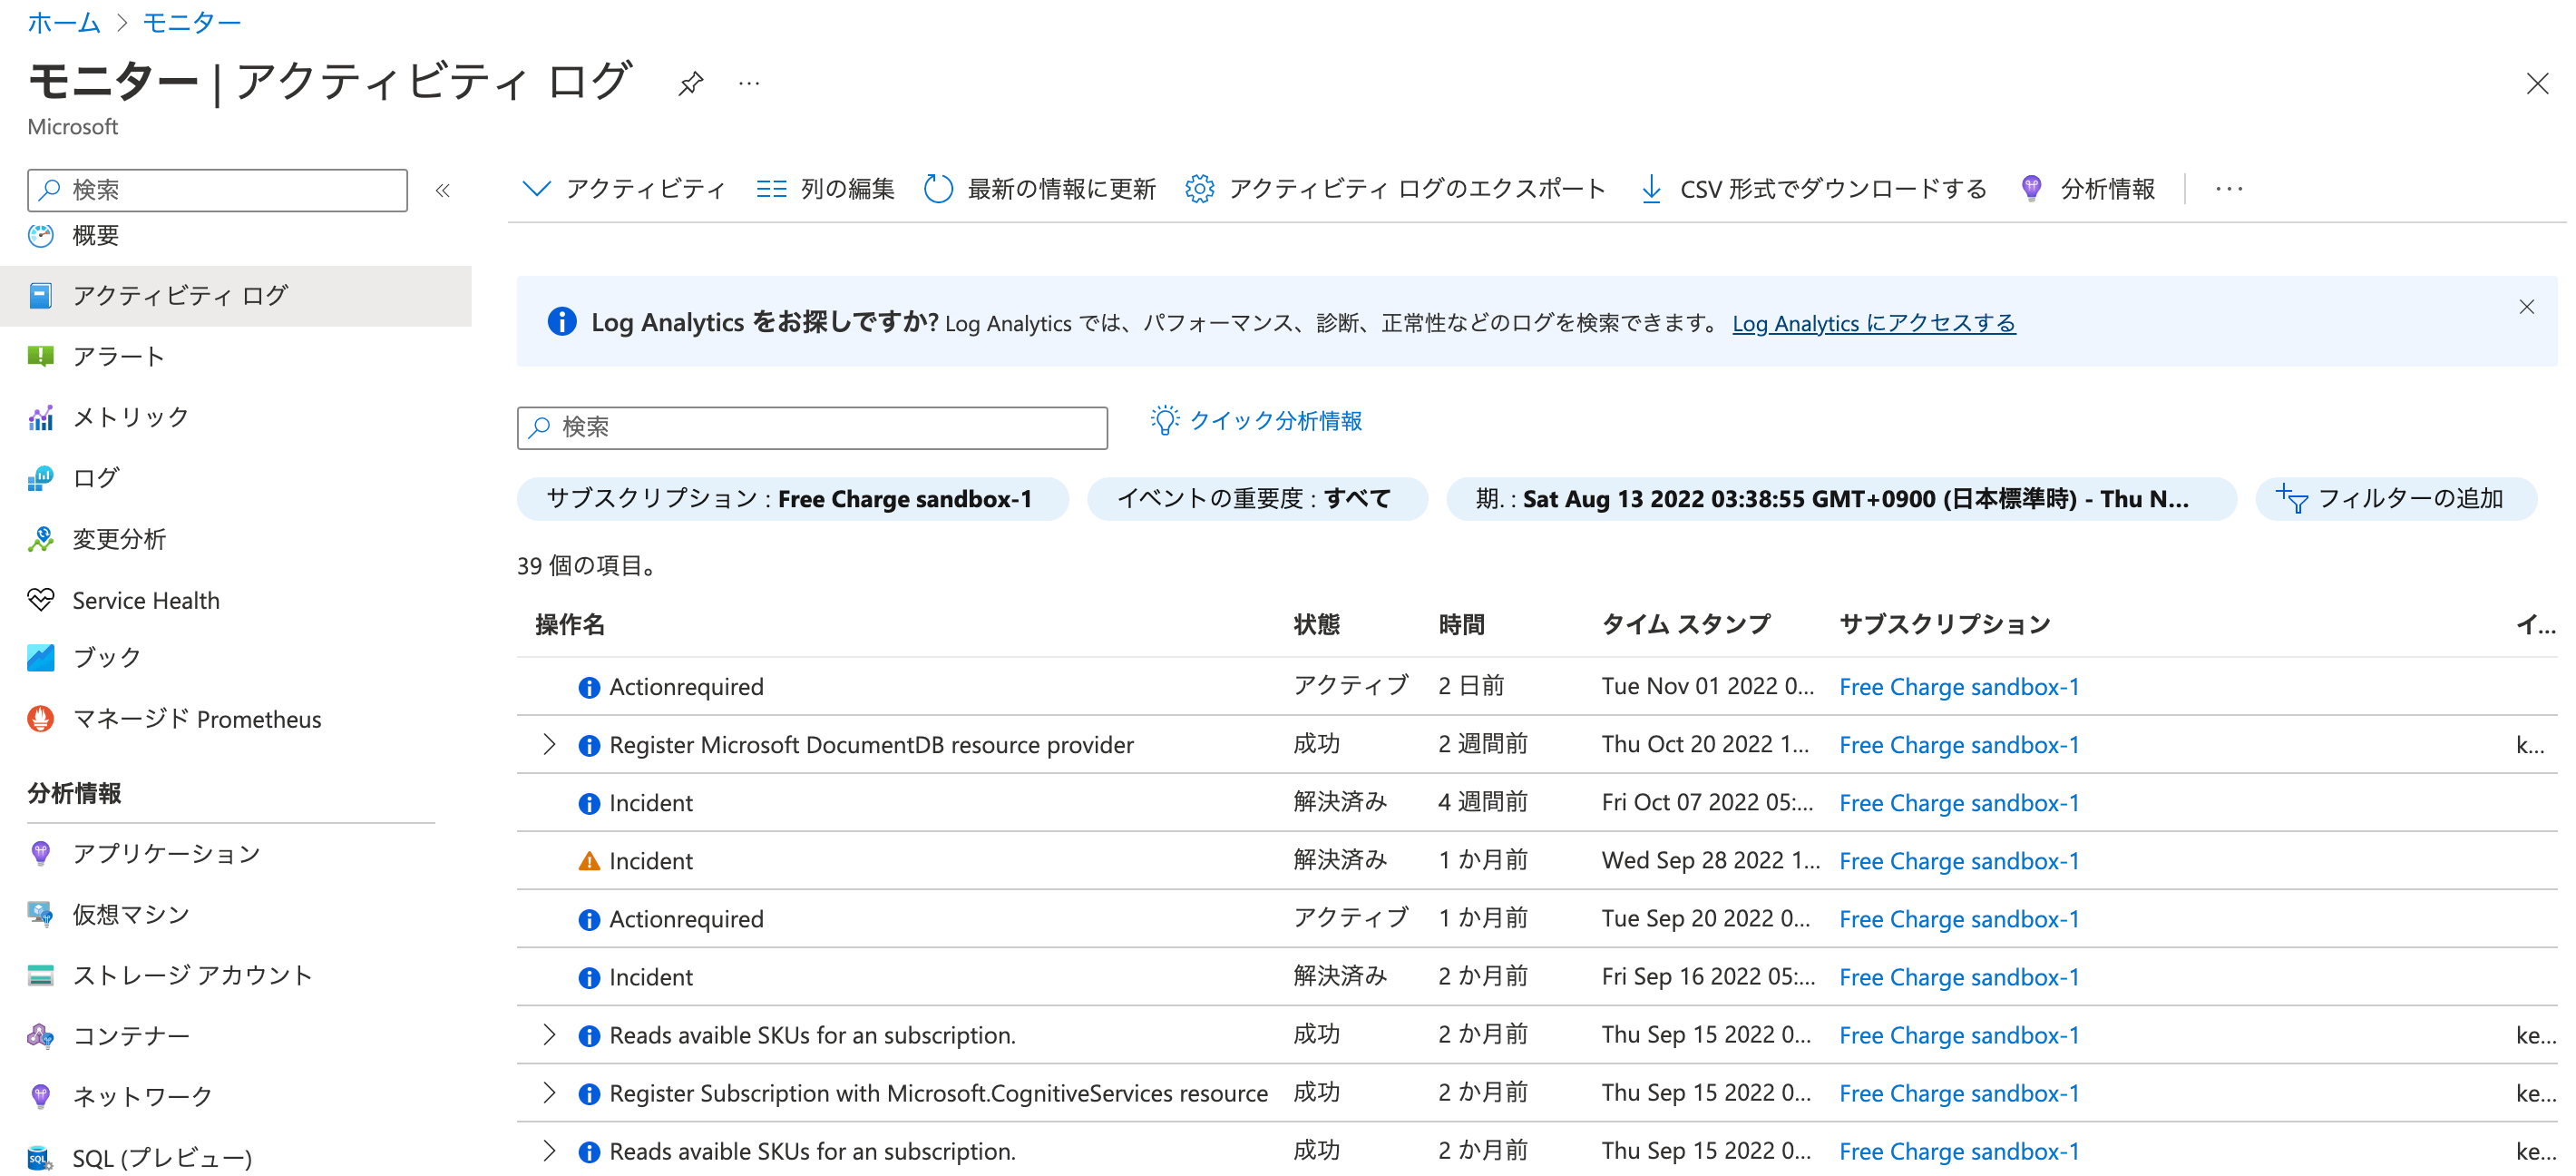
5. An example case for Azure monitor

Monitoring Azure Virtual Machine with Azure Monitor (1) Enable Diagnostic Settings on the Virtual Machine: To start monitoring the Virtual Machine, we need to enable diagnostic settings to collect performance metrics and logs. We'll use Azure CLI to enable diagnostic settings:
az vm diagnostics set \
    --resource-group RESOURCE_GROUP_NAME \
    --vm-name VM_NAME \
    --settings \
    --protected-settings "{\"storageAccountName\":\"STORAGE_ACCOUNT_NAME\", \"storageAccountSasToken\":\"STORAGE_ACCOUNT_SAS_TOKEN\"}" \
    --enabled true                
(2) View Performance Metrics in Azure Monitor: Once the diagnostic settings are enabled, Azure Monitor starts collecting performance metrics. We can view these metrics in the Azure portal.

Go to the Azure portal and navigate to your Virtual Machine. Under the "Monitoring" section, click on "Metrics." Here, you can select different performance metrics like CPU percentage, memory percentage, network in/out, etc. to visualize the VM's performance over time.

(3) Set up Alerts: We can set up alerts to be notified when specific performance thresholds are breached.

(4) Use Azure Application Insights for Application Monitoring (Optional): If your web application is running on the VM, you can integrate Azure Application Insights for application-specific monitoring. Follow the documentation to set up Application Insights in your application code.

Azure Monitor, along with Application Insights, provides a powerful end-to-end monitoring solution for your Azure Virtual Machine and the hosted application.
az monitor metrics alert create \
    --resource-group RESOURCE_GROUP_NAME \
    --name HighCPUAlert \
    --condition "avg Percentage CPU > 80" \
    --description "High CPU Usage Alert" \
    --severity 3 \
    --window-size 5m \
    --evaluation-frequency 1m \
    --action webhooks \
    --webhook-properties "uri=https://your-webhook-url"
                  

6. Cited/Referenced Articles

7. About the proprietary solution "PrismScaler"

・PrismScaler is a web service that enables the construction of multi-cloud infrastructures such as AWS, Azure, and GCP in just three steps, without requiring development and operation. ・PrismScaler is a web service that enables multi-cloud infrastructure construction such as AWS, Azure, GCP, etc. in just 3 steps without development and operation. ・The solution is designed for a wide range of usage scenarios such as cloud infrastructure construction/cloud migration, cloud maintenance and operation, and cost optimization, and can easily realize more than several hundred high-quality general-purpose cloud infrastructures by appropriately combining IaaS and PaaS.  

8. Contact us

This article provides useful introductory information free of charge. For consultation and inquiries, please contact "Definer Inc".

9. Regarding Definer

・Definer Inc. provides one-stop solutions from upstream to downstream of IT. ・We are committed to providing integrated support for advanced IT technologies such as AI and cloud IT infrastructure, from consulting to requirement definition/design development/implementation, and maintenance and operation. ・We are committed to providing integrated support for advanced IT technologies such as AI and cloud IT infrastructure, from consulting to requirement definition, design development, implementation, maintenance, and operation. ・PrismScaler is a high-quality, rapid, "auto-configuration," "auto-monitoring," "problem detection," and "configuration visualization" for multi-cloud/IT infrastructure such as AWS, Azure, and GCP.