1. Introduction
Hello! We are a writer team from Definer Inc.
In this issue, you are wondering about the use of AWS dashboards that can be used in IoT data visualization.
Let's take a look at the actual screens and resources to explain in detail.
2. Purpose/Use Cases
This article summarizes information and practices that can be helpful when you want to visualize IoT data using AWS.
Visualizing IoT data using AWS offers valuable insights and real-time monitoring of massive data streams from connected devices. AWS provides interactive dashboards and scalable cloud services like AWS IoT Core and Amazon Kinesis to handle the influx of data. With AWS's pay-as-you-go model, organizations can cost-effectively scale their infrastructure based on data needs. Integration with various data services enables efficient data processing and preparation for visualization.
3. AWS QuickSight Introduction
QuickSight is the leading AWS dashboard that can be used for IoT data visualization.
QuickSight is a BI service that allows you to easily build an analytical environment in AWS.
Dashboards and reports can be easily created and graphed.
Analysis reports can also be delivered via email.
The main features and purposes of QuickSight include:
- Data Visualization: QuickSight enables users to create compelling visualizations like charts, graphs, and maps to represent data in a meaningful and easily understandable way.
- Interactive Dashboards: Users can build interactive and customizable dashboards using drag-and-drop interfaces. These dashboards can present key performance indicators (KPIs) and real-time data, providing a comprehensive overview of business metrics.
- Ad-hoc Analysis: QuickSight supports ad-hoc data exploration, allowing users to perform data analysis and conduct investigations on the fly.
- Data Integration: The platform integrates with various data sources, making it easier to import and manage data from different systems.
- Scalability: QuickSight is designed to handle large datasets and scale with growing data needs, thanks to its cloud-based architecture.
- Collaboration: QuickSight supports collaborative data analysis and sharing, allowing teams to work together on data projects and share insights across the organization.
- Security: The service offers various security features, including data encryption, access controls, and integration with AWS Identity and Access Management (IAM) for secure data access.
- Pay-as-you-go Model: QuickSight follows a pay-as-you-go pricing model, which means users only pay for the data they analyze and the features they use, making it cost-effective for businesses of all sizes.
- Amazon Services: QuickSight seamlessly integrates with various AWS data services, such as Amazon Redshift, Amazon RDS (Relational Database Service), Amazon Athena, Amazon S3 (Simple Storage Service), Amazon Aurora, Amazon EMR (Elastic MapReduce), and more.
- On-Premises Databases: QuickSight allows you to connect to on-premises databases, like SQL Server, MySQL, PostgreSQL, and other databases through AWS Direct Connect or AWS VPN (Virtual Private Network).
- Third-Party Databases: You can connect QuickSight to third-party databases like Salesforce, Snowflake, and other supported databases using connectors and APIs.
- Big Data Platforms: QuickSight supports big data platforms like Apache Spark on Amazon EMR, enabling you to analyze and visualize large-scale data.
- Cloud-Based Data Sources: Besides AWS services, QuickSight can connect to cloud-based databases and data warehouses hosted outside of AWS.
- CSV and Excel Files: You can upload CSV or Excel files directly into QuickSight to create visualizations and dashboards.
- Custom Data Sources: QuickSight also offers the option to connect to custom data sources using JDBC (Java Database Connectivity) or ODBC (Open Database Connectivity) drivers.
4. Getting Started with QuickSight
In fact, let's get started with QuickSight.
First, we will create a QuickSight account as a preparation
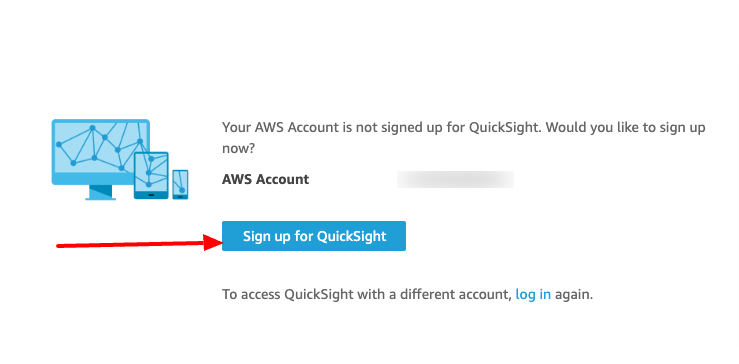
(1) After logging in to AWS, go to the QuickSight screen and press Sign Up for QuickSight.
(2) Select Standard Edition.
(3) When you are transferred to the QuickSight screen, your account has been successfully created.
 Next, create a dashboard.
(4) Select any sample data set from the Data Sets tab, and click "Create Analysis".
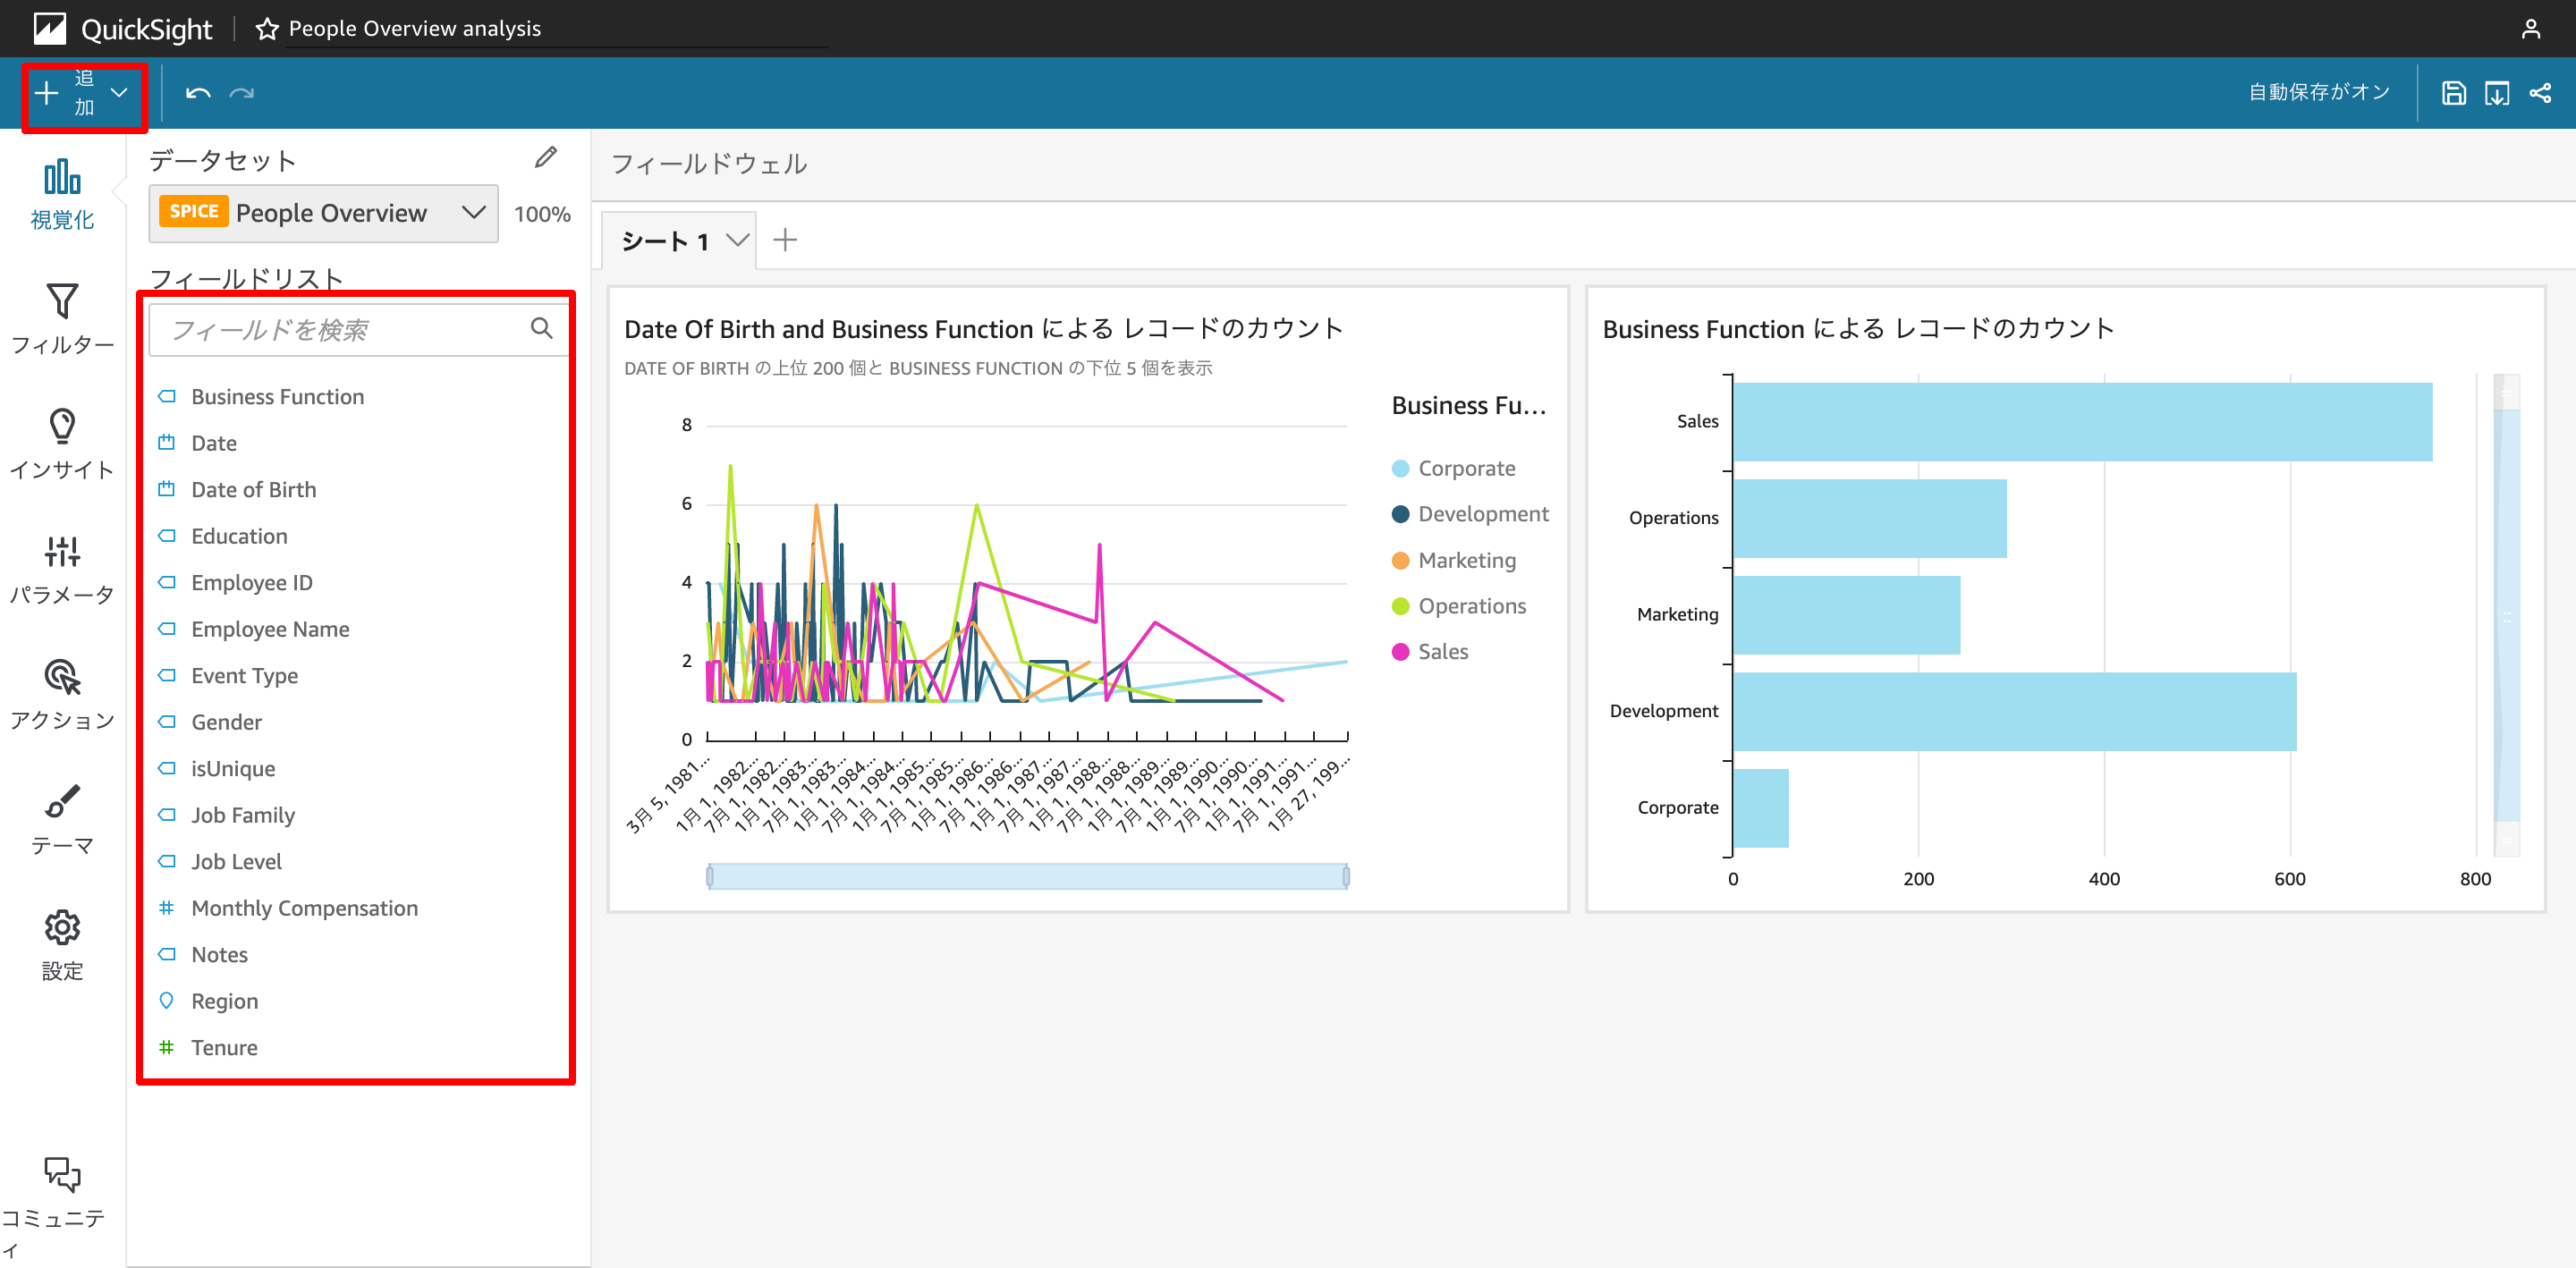
(5) Just select the fields and it will create a nice looking graph.
(6) You can also add graphs and tables by clicking the "Add" button.

 Next, create a dashboard.
(4) Select any sample data set from the Data Sets tab, and click "Create Analysis".
(5) Just select the fields and it will create a nice looking graph.
(6) You can also add graphs and tables by clicking the "Add" button.

5. Cited/Referenced Articles
6. About the proprietary solution "PrismScaler"
・PrismScaler is a web service that enables the construction of multi-cloud infrastructures such as AWS, Azure, and GCP in just three steps, without requiring development and operation.
・PrismScaler is a web service that enables multi-cloud infrastructure construction such as AWS, Azure, GCP, etc. in just 3 steps without development and operation.
・The solution is designed for a wide range of usage scenarios such as cloud infrastructure construction/cloud migration, cloud maintenance and operation, and cost optimization, and can easily realize more than several hundred high-quality general-purpose cloud infrastructures by appropriately combining IaaS and PaaS.
7. Contact us
This article provides useful introductory information free of charge. For consultation and inquiries, please contact "Definer Inc".
8. Regarding Definer
・Definer Inc. provides one-stop solutions from upstream to downstream of IT.
・We are committed to providing integrated support for advanced IT technologies such as AI and cloud IT infrastructure, from consulting to requirement definition/design development/implementation, and maintenance and operation.
・We are committed to providing integrated support for advanced IT technologies such as AI and cloud IT infrastructure, from consulting to requirement definition, design development, implementation, maintenance, and operation.
・PrismScaler is a high-quality, rapid, "auto-configuration," "auto-monitoring," "problem detection," and "configuration visualization" for multi-cloud/IT infrastructure such as AWS, Azure, and GCP.

